http://www.sciencemag.org/news/2016/08/just-90-companies-are-blame-most-climate-change-carbon-accountant-says
Smil: https://vaclavsmil.com/wp-content/uploads/2021/03/smil-energyconversion2021-1.pdf
1976 LBNL doc: https://escholarship.org/uc/item/3dz5d805
and https://archive.org/details/explaining-energy
Here's a hacked together interactive Sankey that I did with Protovis: http://bl.ocks.org/728723
Data is in JSON format.

The successor to Protovis -- d3 -- has a Sankey layout: http://bost.ocks.org/mike/sankey/
d3 also takes care of transitions: http://bl.ocks.org/mbostock/1256572

Some of my notes on Sankeys:
Spaghetti 1: http://www.energyliteracy.com/?p=293
Spaghetti 2: http://www.energyliteracy.com/?p=310
The QTR is basically an analysis of the energy flow diagram for the US -- a kind of overlay that is given iconic status, as shown here in their cover image and "legend":
http://energy.gov/downloads/report-first-quadrennial-technology-review


USA Energy Flow Chart, with archives (2010 and 2011 don't reference data):
https://flowcharts.llnl.gov/

Slightly interactive version at National Academies:
http://needtoknow.nas.edu/energy/interactive/our-energy-system/

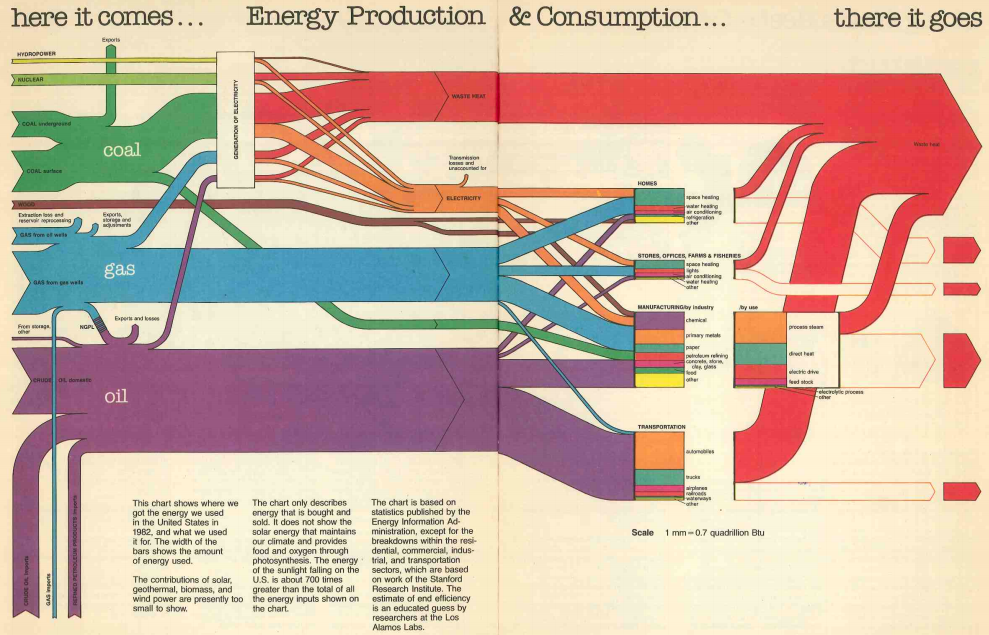
This might be my favorite version, from Energy88, with both imports and the subcategories broken down as stacked bar charts. It even shows that the "useful" energy winds up as "waste". Energy88-Sankey.pdf
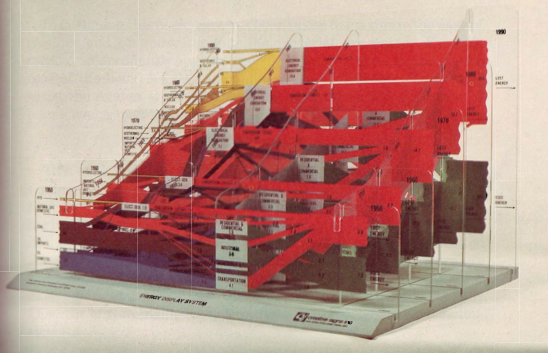
Here's the Energy Display System, that was created by CSIS in the 70s. The "cross-plots" are themselves interesting graphs.
CSIS even got an episode of The Flintstones produced to help spread the word -- narrated by Charlton Heston!
http://vintagetoledotv.squarespace.com/print-ads-wxyz/wxyz-tv-7-print-ads/2309588

The original diagram by Captain Sankey was for steam engine efficiency!
http://en.wikipedia.org/wiki/Matthew_Henry_Phineas_Riall_Sankey

It's from this book, but Plate V is missing from the back of the Google book:
http://books.google.com/books?id=EwkAAAAAMAAJ&pg=PA278
Somebody remade it: http://forum.e-sankey.com/index.php?topic=259.0
Thesis (in German) on Sankey: http://umwelt.hs-pforzheim.de/fileadmin/dokumente/2006/Nr_124-Der_Einsatz_von_Sankey-Diagrammen_im_Stoffstrommanagement.pdf
Wikipedia: http://en.wikipedia.org/wiki/Matthew_Henry_Phineas_Riall_Sankey
Sankey's books:
“The Maps of the Ordnance Survey” (1888)
“The Thermal Efficiency of Steam Engines” (1895)
“Governing of Steam Engines by Throttling and by Variable Expansion” (1895)
“Interim Report of the Committee on tabulating the Results of Steam-Engine and Boiler Trials” (1902)
“The Energy Chart. Practical Applications to Reciprocal Steam-Engines” (1905)
http://archive.org/details/energychart030918mbp
Sankey's obit: http://www.icevirtuallibrary.com/content/article/10.1680/imotp.1926.14022
Teaching Sankeys
The Household Energy Game, 1974, had people estimate their energy use through a series of questions, then fill in a grid representing 100% of an average American's energy use to see how they compare.
HouseholdEnergyGame.pdf and background info HouseholdEnergyGame-Annotated.pdf
Here's a 2009 version, roughly colorized based on possible fuel source -- oil (green), natural gas (blue), and electricity (yellow):

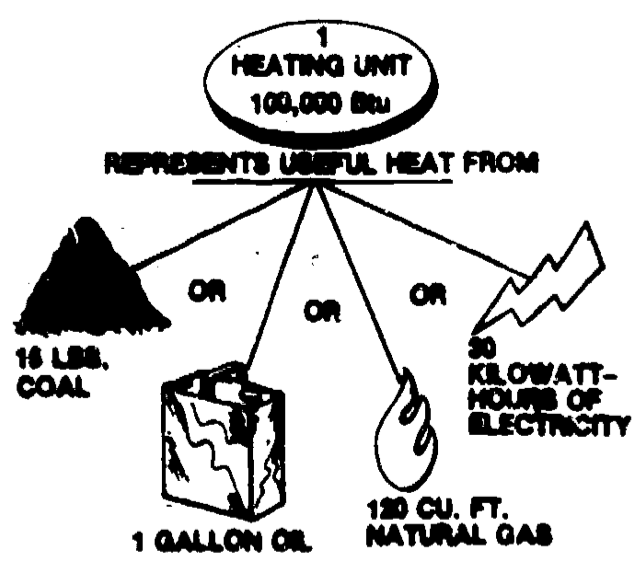
Other energy education materials from the 70s tried to demonstrate the equivalence of energy units:

In the UK, they have students map cut-out squares to Sankeys:
http://www.nationalstrategies.standards.dcsf.gov.uk/node/289495?uc=force_uj

This can be done for multiple items:
"Energy Flow Diagrams for Teaching Physics Concepts"
The Physics Teacher Vol. 42, Feb 2004, pp. 113-117.
http://physics.uark.edu/hobson/pubs/04.02.energy%20flow%20diags.html?filetype=pdf&id=PHTEAH000042000002000113000001&idtype=cvips
Typical power flow in an unaccelerated car at highway speed. For a typical acceleration, these flows are multiplied by five:

DIAGRAM CONFUSIONS, AND EXERGY
From "A Bridge to the Renewable Energy Future" by Robert U. Ayres and Ed Ayres
http://www.worldwatch.org/node/6225
"Efficiency is a slippery concept. On the surface it is a simple ratio between an output and an input. That is perfectly satisfactory as long as the inputs and outputs are measuring the same thing in the same way. In the case of energy, however, it is tricky because, as explained by the First Law of Thermodynamics, "energy" is actually conserved. That means that the energy exiting from any process or transformation is always equal to the energy going into the process. There is no gain or loss, so the efficiency must be 100 percent by definition. So, the first problem with the Bridges document (and almost all public discussions of energy) is that these discussions are not really about energy, but about the useful component, which they do not define. However there is a technical definition of useful energy, which is energy that can do useful work. The technical term is exergy."
From "THE PHYSICIST'S ROLE IN USING ENERGY EFFICIENTLY: REFLECTIONS ON THE 1974 AMERICAN PHYSICAL SOCIETY SUMMER STUDY AND ON THE TASK AHEAD"
R. H. Socolow
AIP Conf. Proc. -- November 25, 1985 -- Volume 135, pp. 15-32
FREE DOWNLOAD: http://link.aip.org/link/?APCPCS/135/15/1
"The problem is in the spaghetti! Many an unsuspecting banker or congressman, seeking to gauge the relative promise of alternative ventures in energy conservation, was led to conclude that 73 percent efficient water heating and space heating could scarcely be improved, while 33 percent efficient electricity production had to be ripe for a major breakthrough. The ubiquitous spaghetti diagrams pointed the investor and legislator away from the distinction between heat and work, by means of which it would have been possible to comprehend a heat pump four or more times more effective at using fuel or electricity to heat air or water.
"The APS Study reminded its audience that thermodynamics led naturally to the concept of "available work" and, thence, to a "Second Law Efficiency" by means of which all tasks (including, in particular, space and water heating and electricity generation) could be evaluated, without distorting comparisons across tasks. 'We strongly recommend," the Report said (p. 5), "that this formulation, or a similar one, be widely adopted by the scientific and technical community as a standard from which all tasks should be measured, and against which all devices should be evaluated.""
"Primary- and Secondary-Level Energy Education in the UK"
M. Newborough, P. Getvoldsen, D. Probert & P. Page
Applied Energy 40 (1991) 119-156
http://dx.doi.org/10.1016/0306-2619(91)90018-S
"Ogborn and Ross believe that there is a need to find a new term for the everyday meaning of energy. Many secondary pupils comprehend 'energy' as the 'fuel'--the scientific concept corresponding with this being that of 'available energy' or exergy--and so they instinctively believe that energy 'gets used up'. That is, pupils appreciate exergy, not energy. The possibility of change is represented by exergy; energy is what takes part in the change. Ogborn describes free energy as the 'go' of all things. Ross rightly points out that employment of the term 'free energy' should be avoided because it is not free. Instead he recommends using 'fuel value' or 'available energy'. The present authors would prefer the latter term or exergy. Wall suggests the concept of energy would appear less daunting if the following definitions were adopted: (i) energy is motion or the ability to produce motion; (ii) exergy is work or the ability to produce work."
"Exergy as a Tool for Sustainability" MARC A. ROSEN
3rd IASME/WSEAS Int. Conf. on Energy & Environment, University of Cambridge, UK, February 23-25, 2008
http://portal.acm.org/citation.cfm?id=1576777
Power (left) and Exergy (right):

National exergy diagrams from Sweden:
"Exergy -- A Useful Concept" Göran Wall, 1986
http://www.exergy.se/ftp/thesis.pdf
The Swedish energy and material conversion in 1920 (670 PJ.) and 1975 (2 500 PJ/yr.), in terms of exergy.


Wes Hermann's Exergy at GCEP Stanford:
http://gcep.stanford.edu/pdfs/DyUMPHW1jsSmjoZfm2XEqg/1.3-Hermann.pdf
http://gcep.stanford.edu/research/exergycharts.html
ENERGY AND ENTROPY
An interesting but not widely accepted idea is to treat energy and entropy as fluid-like quantities, where energy is conserved and entropy is half-conserved -- it can be produced but not destroyed. Then a measure of "efficiency" is in terms of how much entropy is produced. Below are some Sankey diagrams from a science education paper that explore this idea. Here the entropy is added on, unlike the exergy which is "used up."
"Renewable energy sources in terms of entropy"
Jan-Peter Meyn 2011 Eur. J. Phys. 32 185
http://dx.doi.org/10.1088/0143-0807/32/1/017
Straight flow from hot to cold reservoir (entropy produced)

With a reversible heat engine in the middle (note no entropy produced):

A hydroelectric power plant (including the water cycle):

CO2 Sankey:
http://cait.wri.org/figures.php?page=/World-FlowChart
More Energy Sankey examples:
nice sunlight/energy used: http://sunenergyfacts.com/2008/01/solar-energy-fact-1/
nice in-home split (though for swimming pool): http://www.energy-transparency.com/images/sankeys/Sankey%20minimal.jpg
just search Google for "energy sankey" or "engine sankey"
Other notes on MAKING SANKEYS
OmniGraffle? http://www.omnigroup.com/mailman/archive/omnigraffle-users/2009/004989.html
Example: http://aspoireland.files.wordpress.com/2011/05/global-energy-conversion-to-economic-services1.png
Processing: http://sjbrenner.com/2010/sankey-diagram-generator-code/
Not a Sankey, but has sliders (prolly too many): http://my2050.decc.gov.uk/
Comments (0)
You don't have permission to comment on this page.